
 Facebook
 X
X
 Pinterest
 Copy Link

NTREIS* MLS Systems
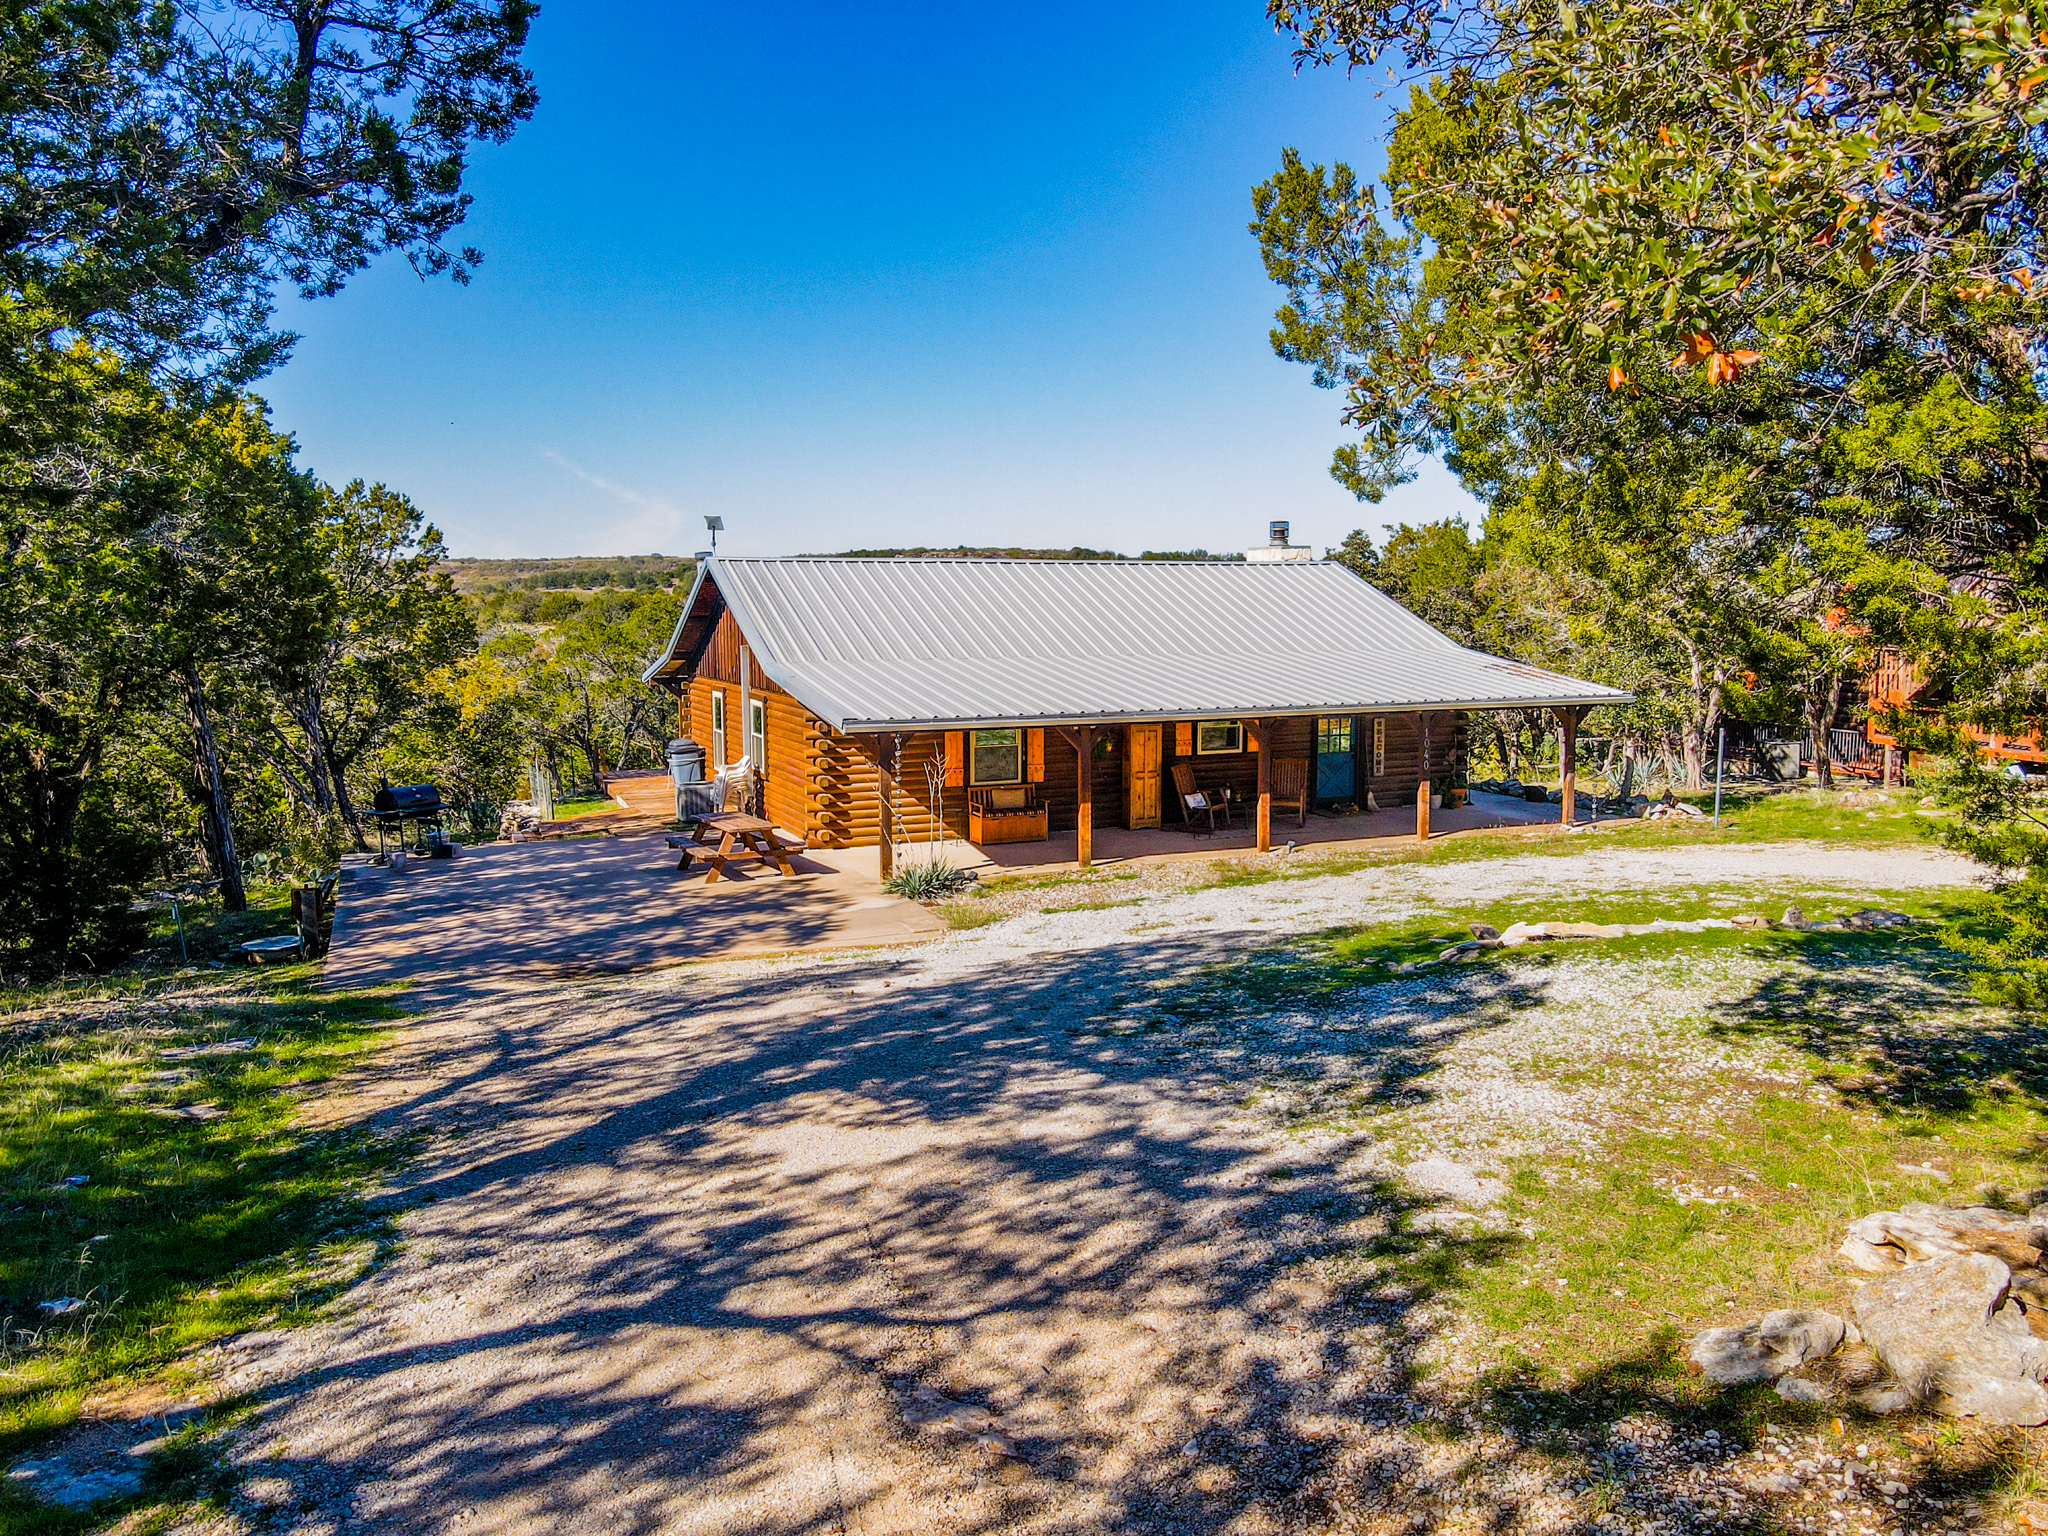
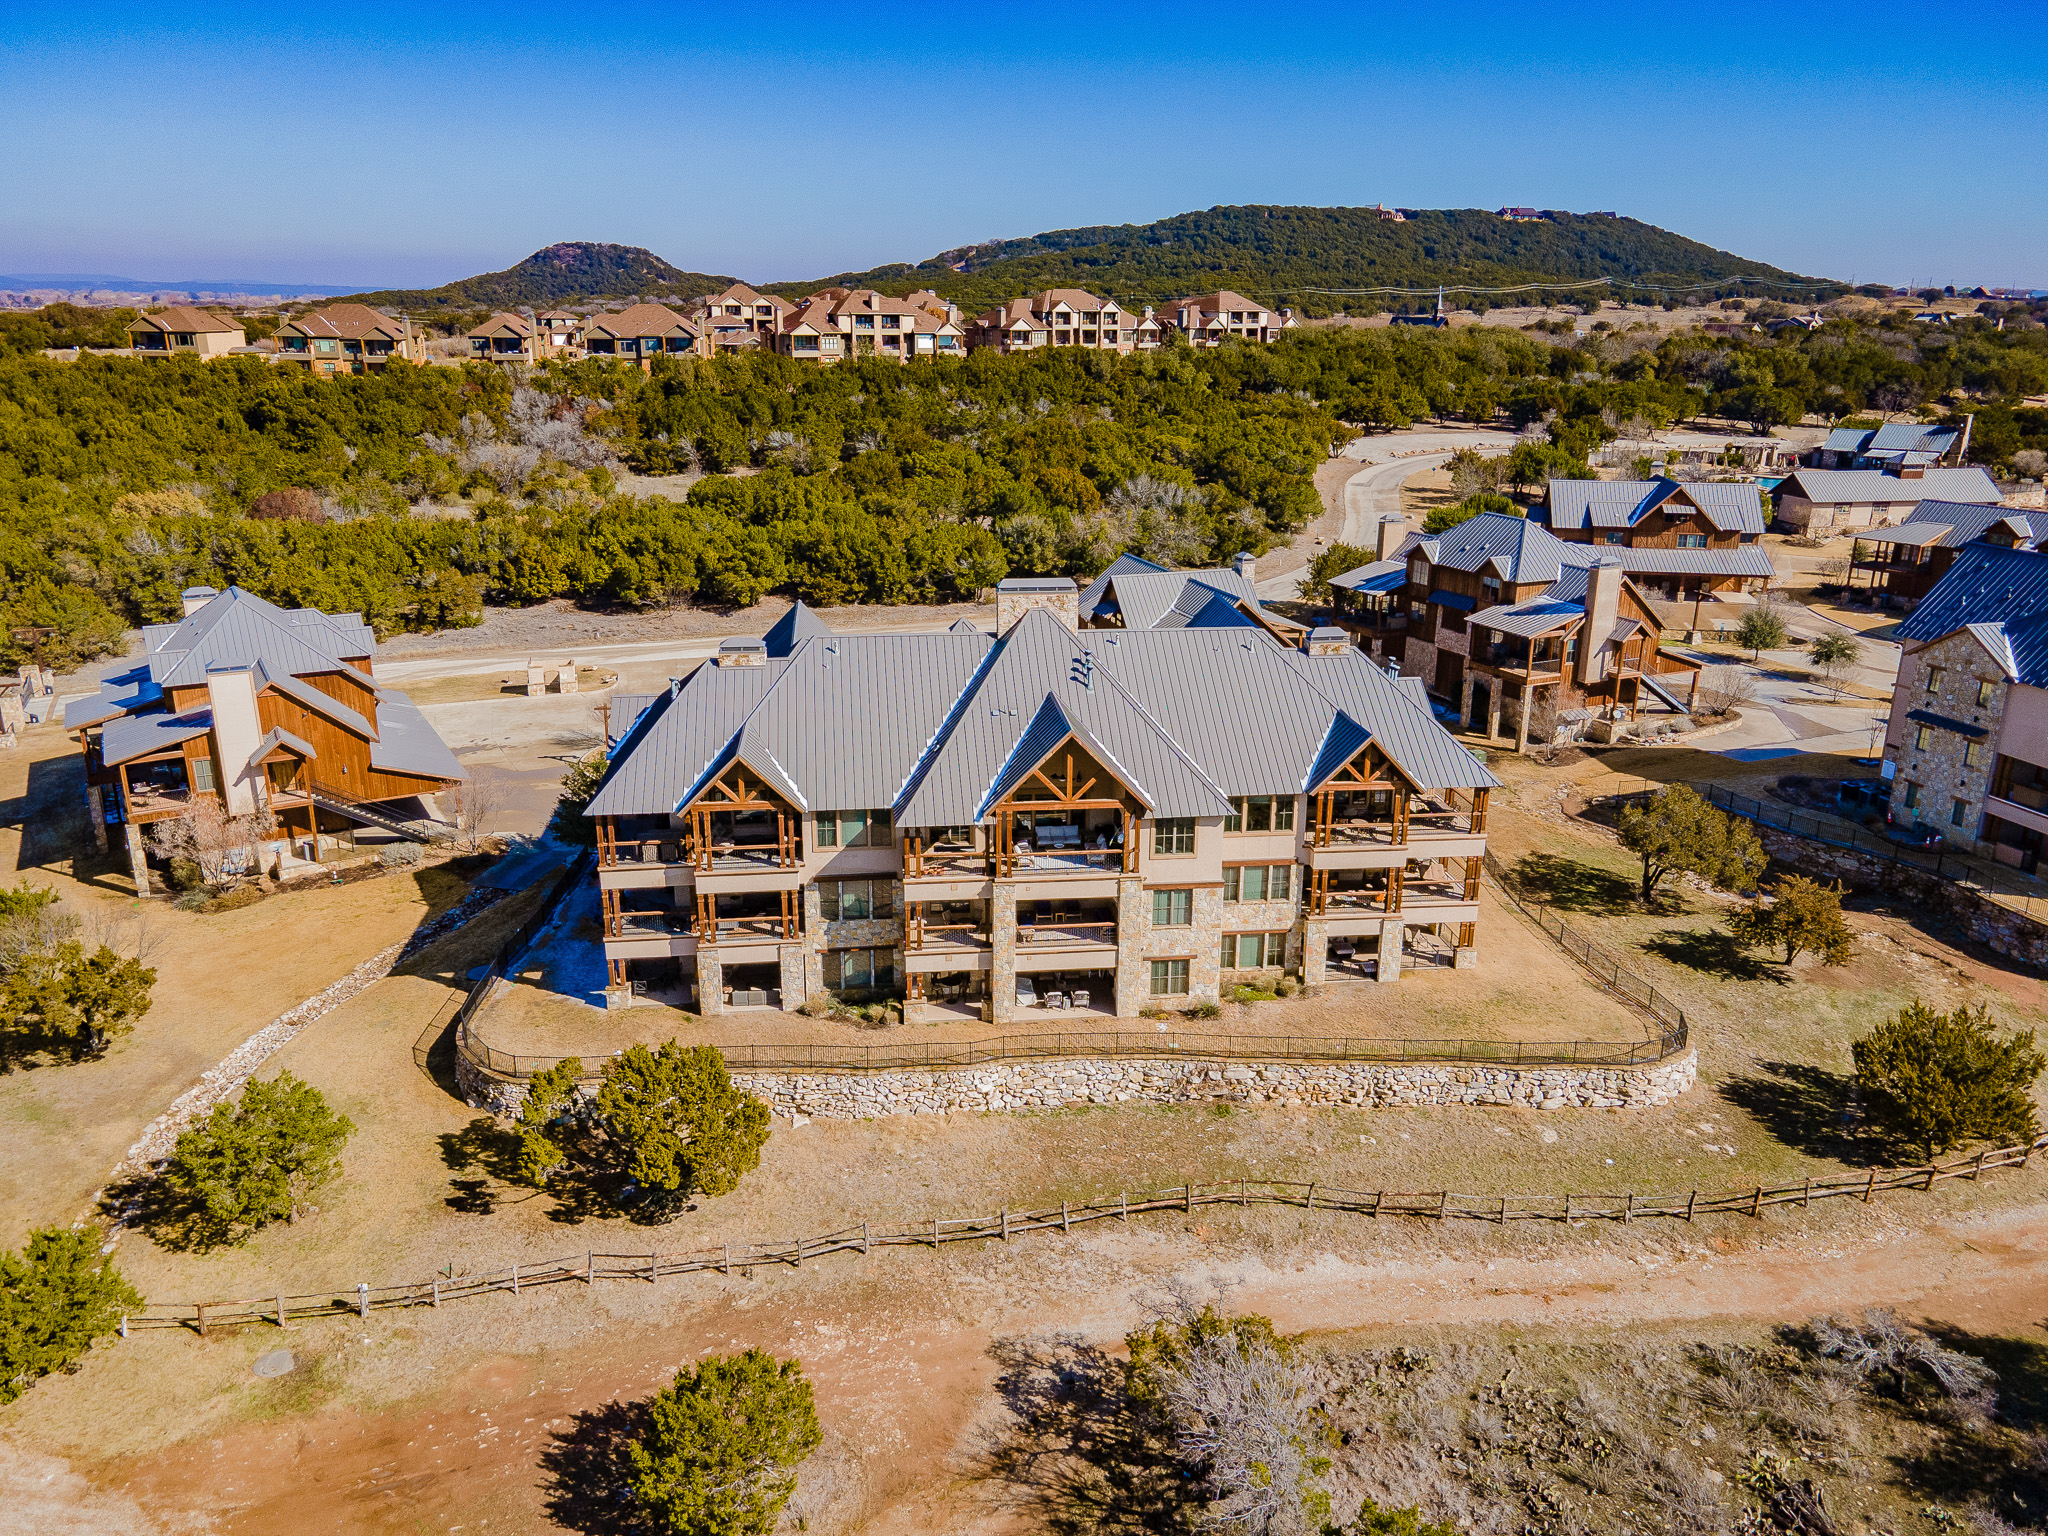
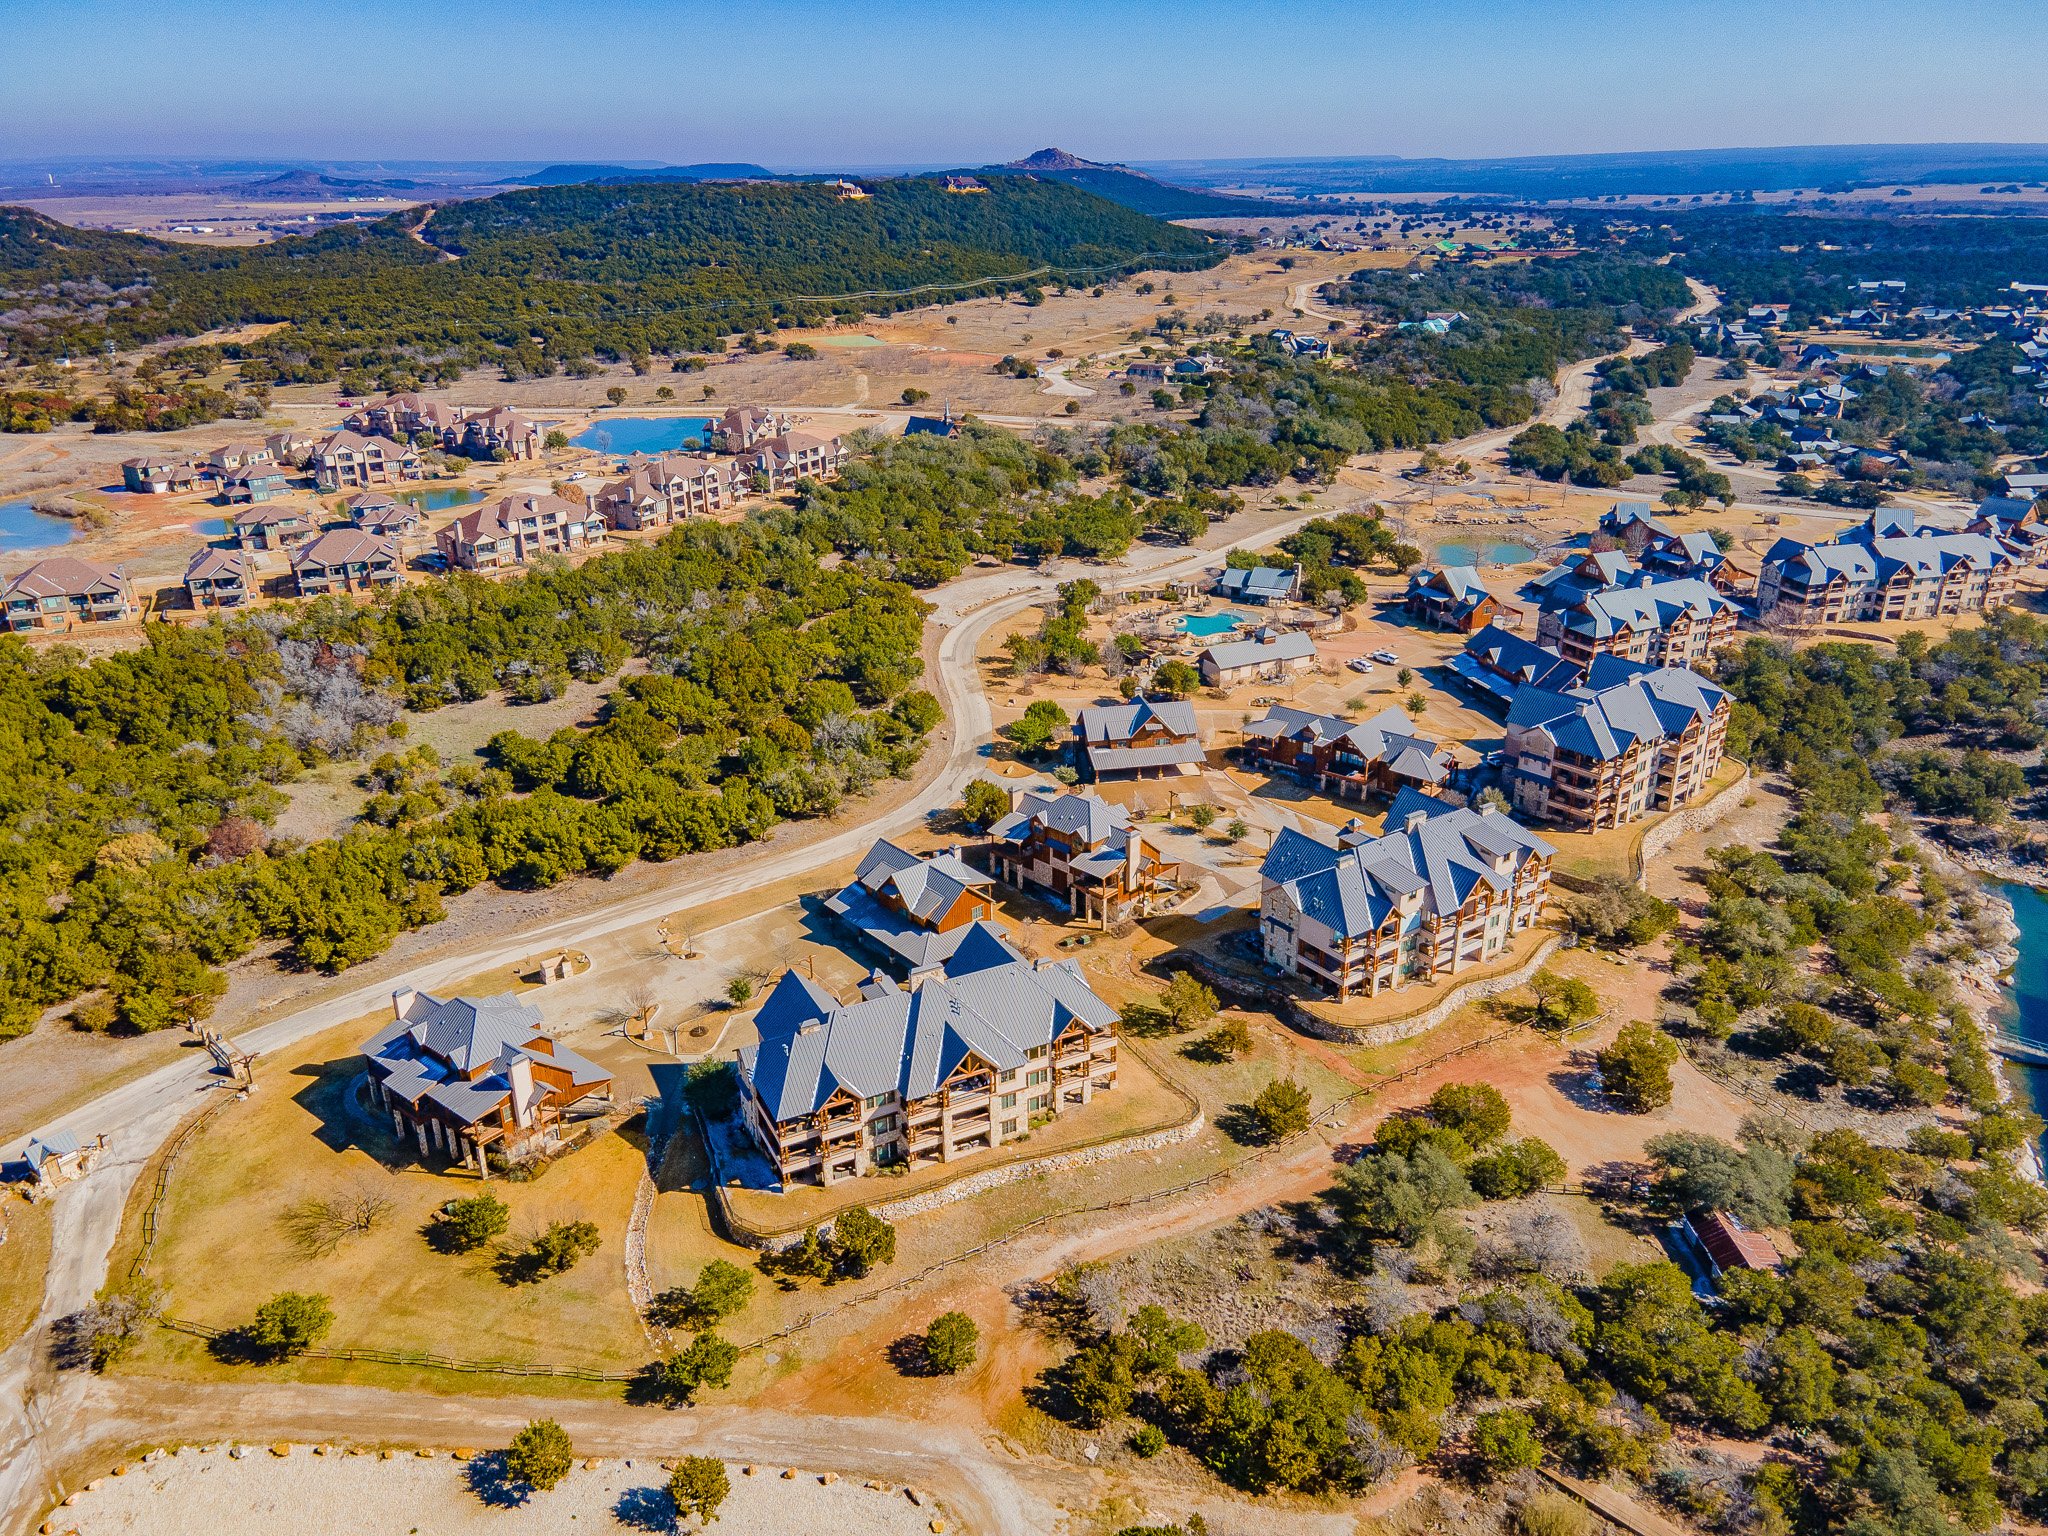
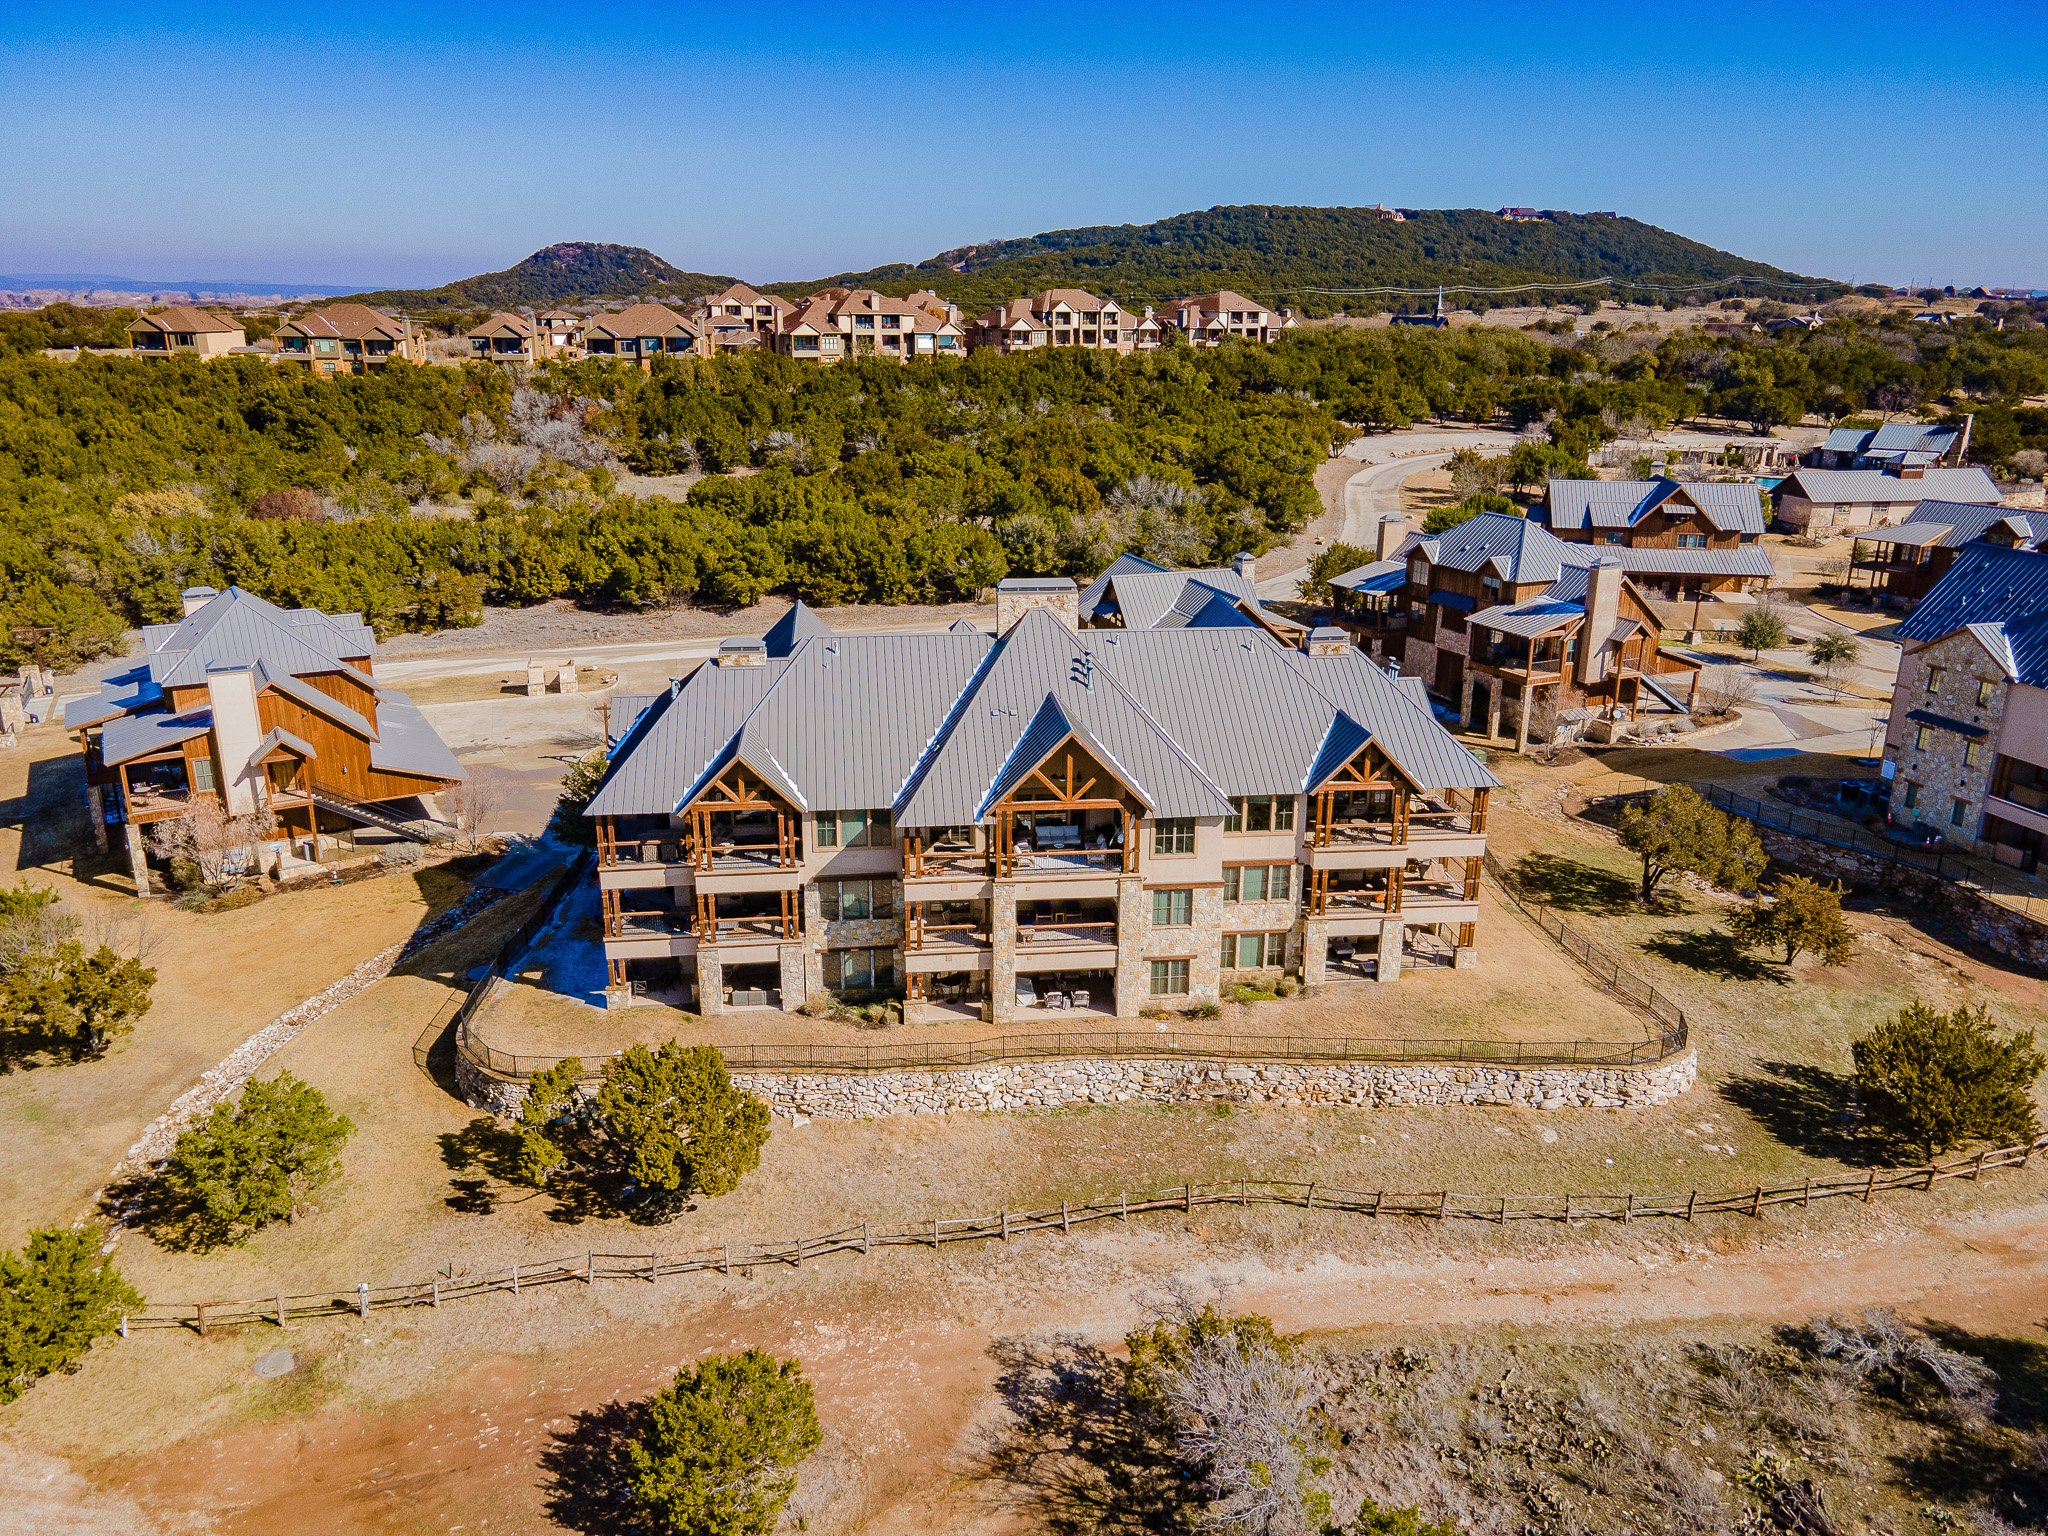
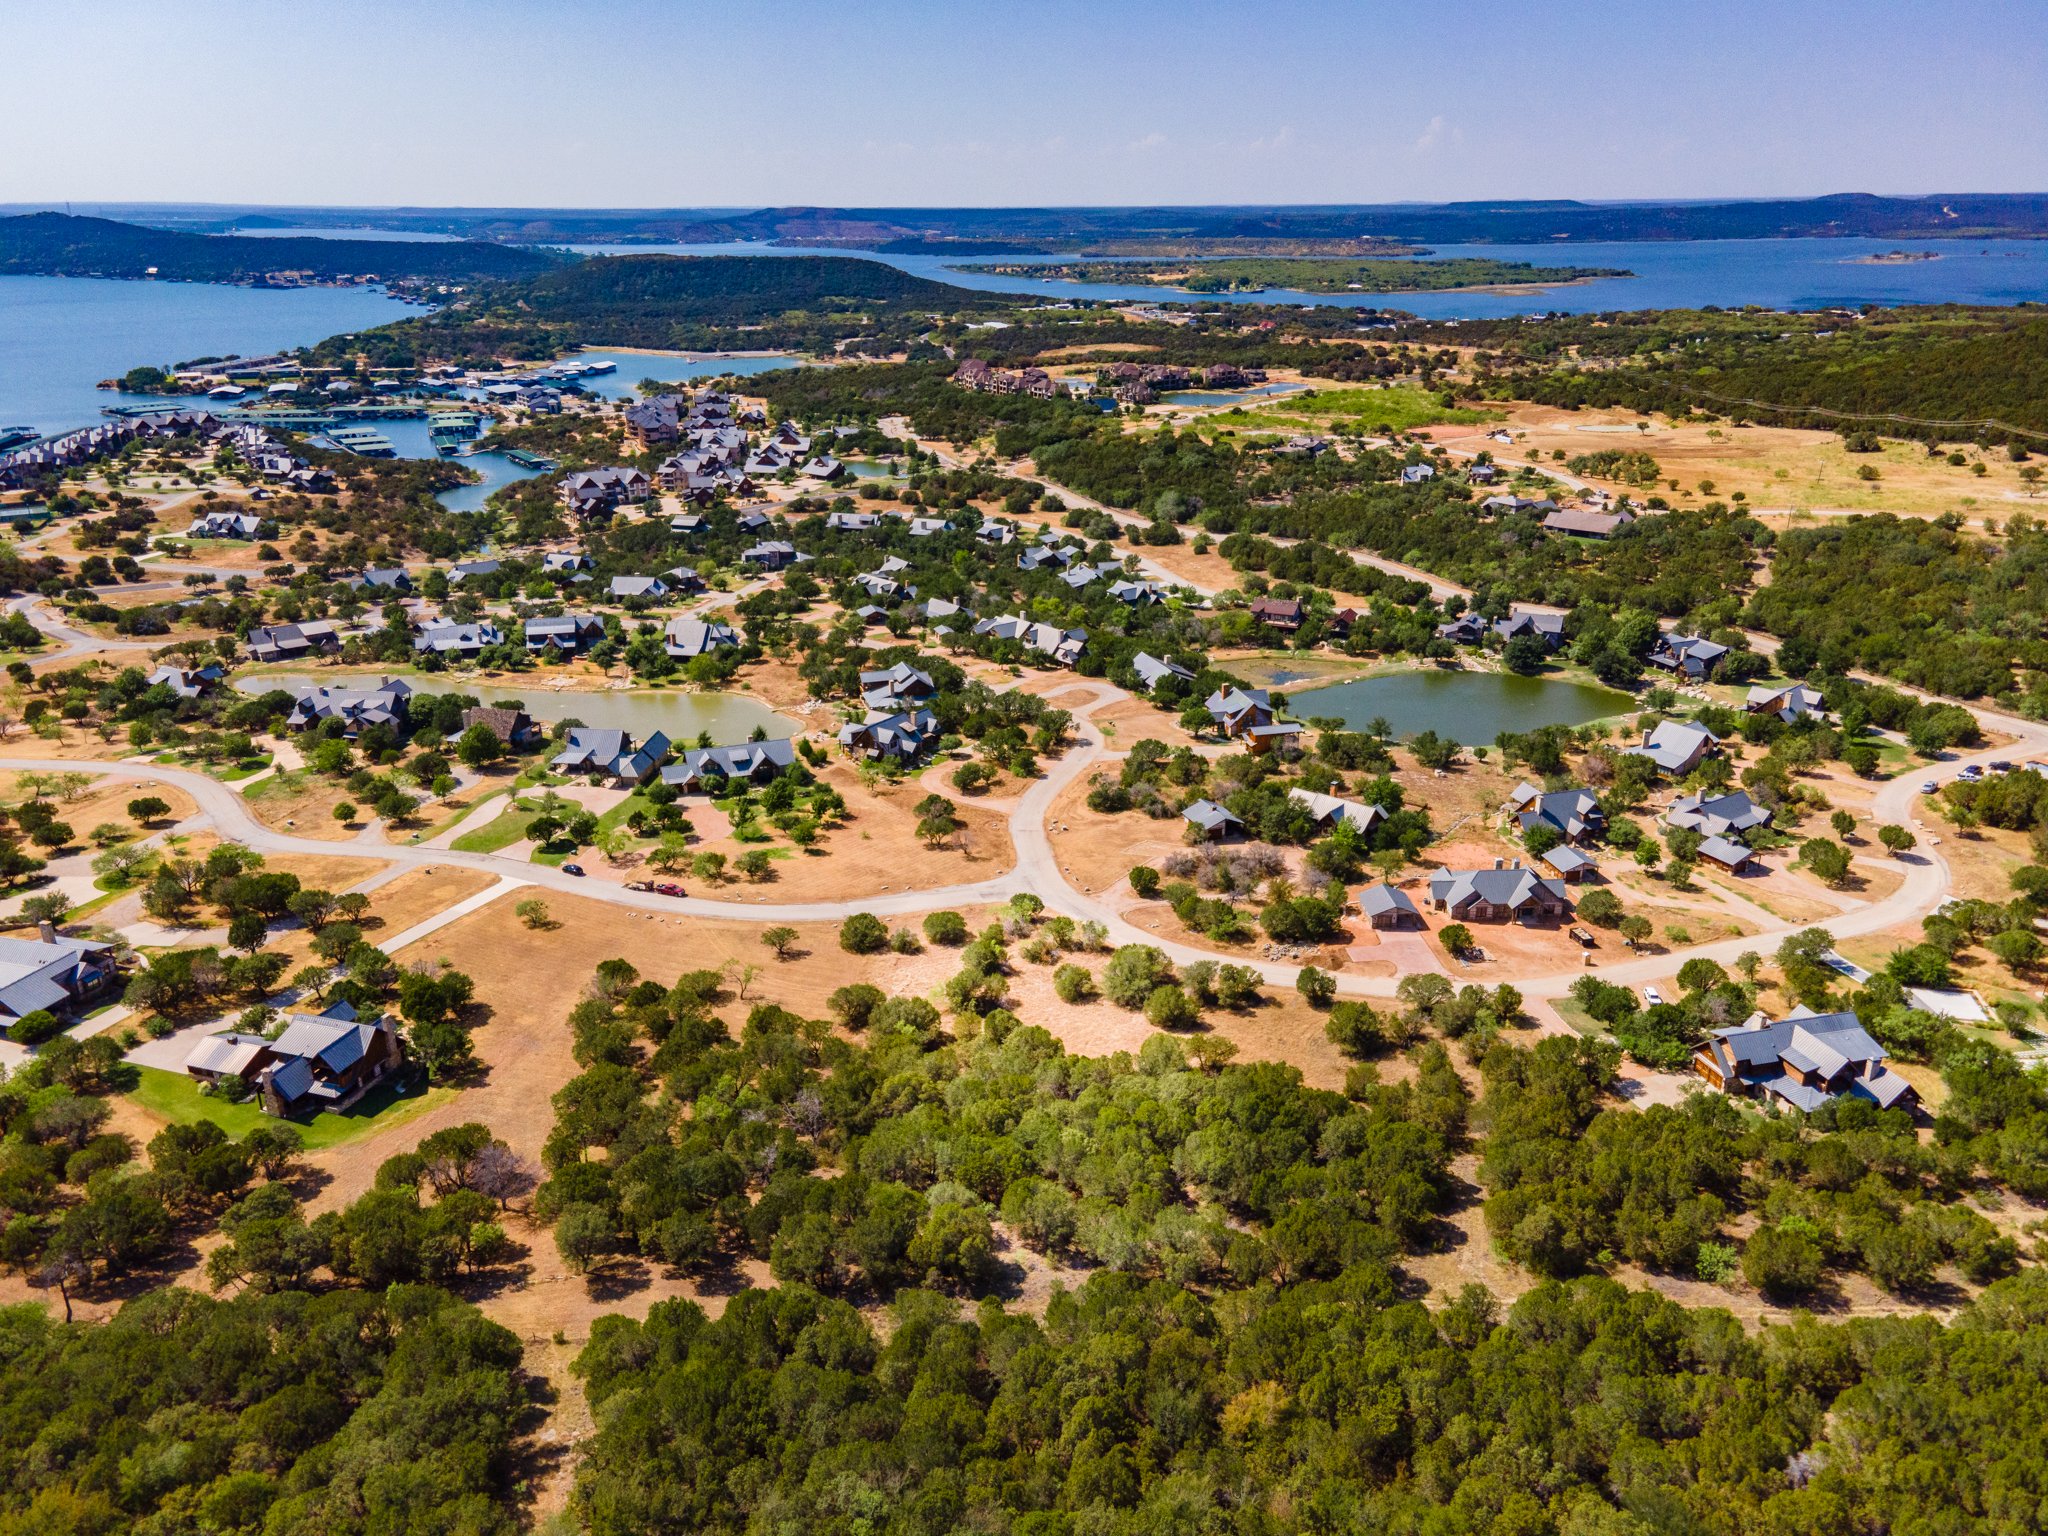
The Cliffs Resort
Possum Kingdom Lake
Market Report 4th Quarter
2022 and 2023 Comparison
By Matthew Renfro
And like that, 2023 is over and 2024 has started. The home market as a whole has seen a rise in value, lot sales in The Cliffs have dropped pretty significantly, and the condo market rides on steadily. Let’s break down some of the trends and patterns seen in the 2023 Cliffs at Possum Kingdom real Estate Market. We will wrap up with a quick overview of the active market. So let’s get started.
4th Quarter Comparison

Lots
In the 4th quarter of 2023, the lot sales witnessed a slight decrease in transactions compared to 2022, with 9 sales versus 10. However, there was a significant drop in the average sales price, from $26,900 in 2022 to $10,222 in 2023. This change, along with an increase in average lot size from 0.23 to 0.26 acres, suggests a shift toward larger but less expensive lots.
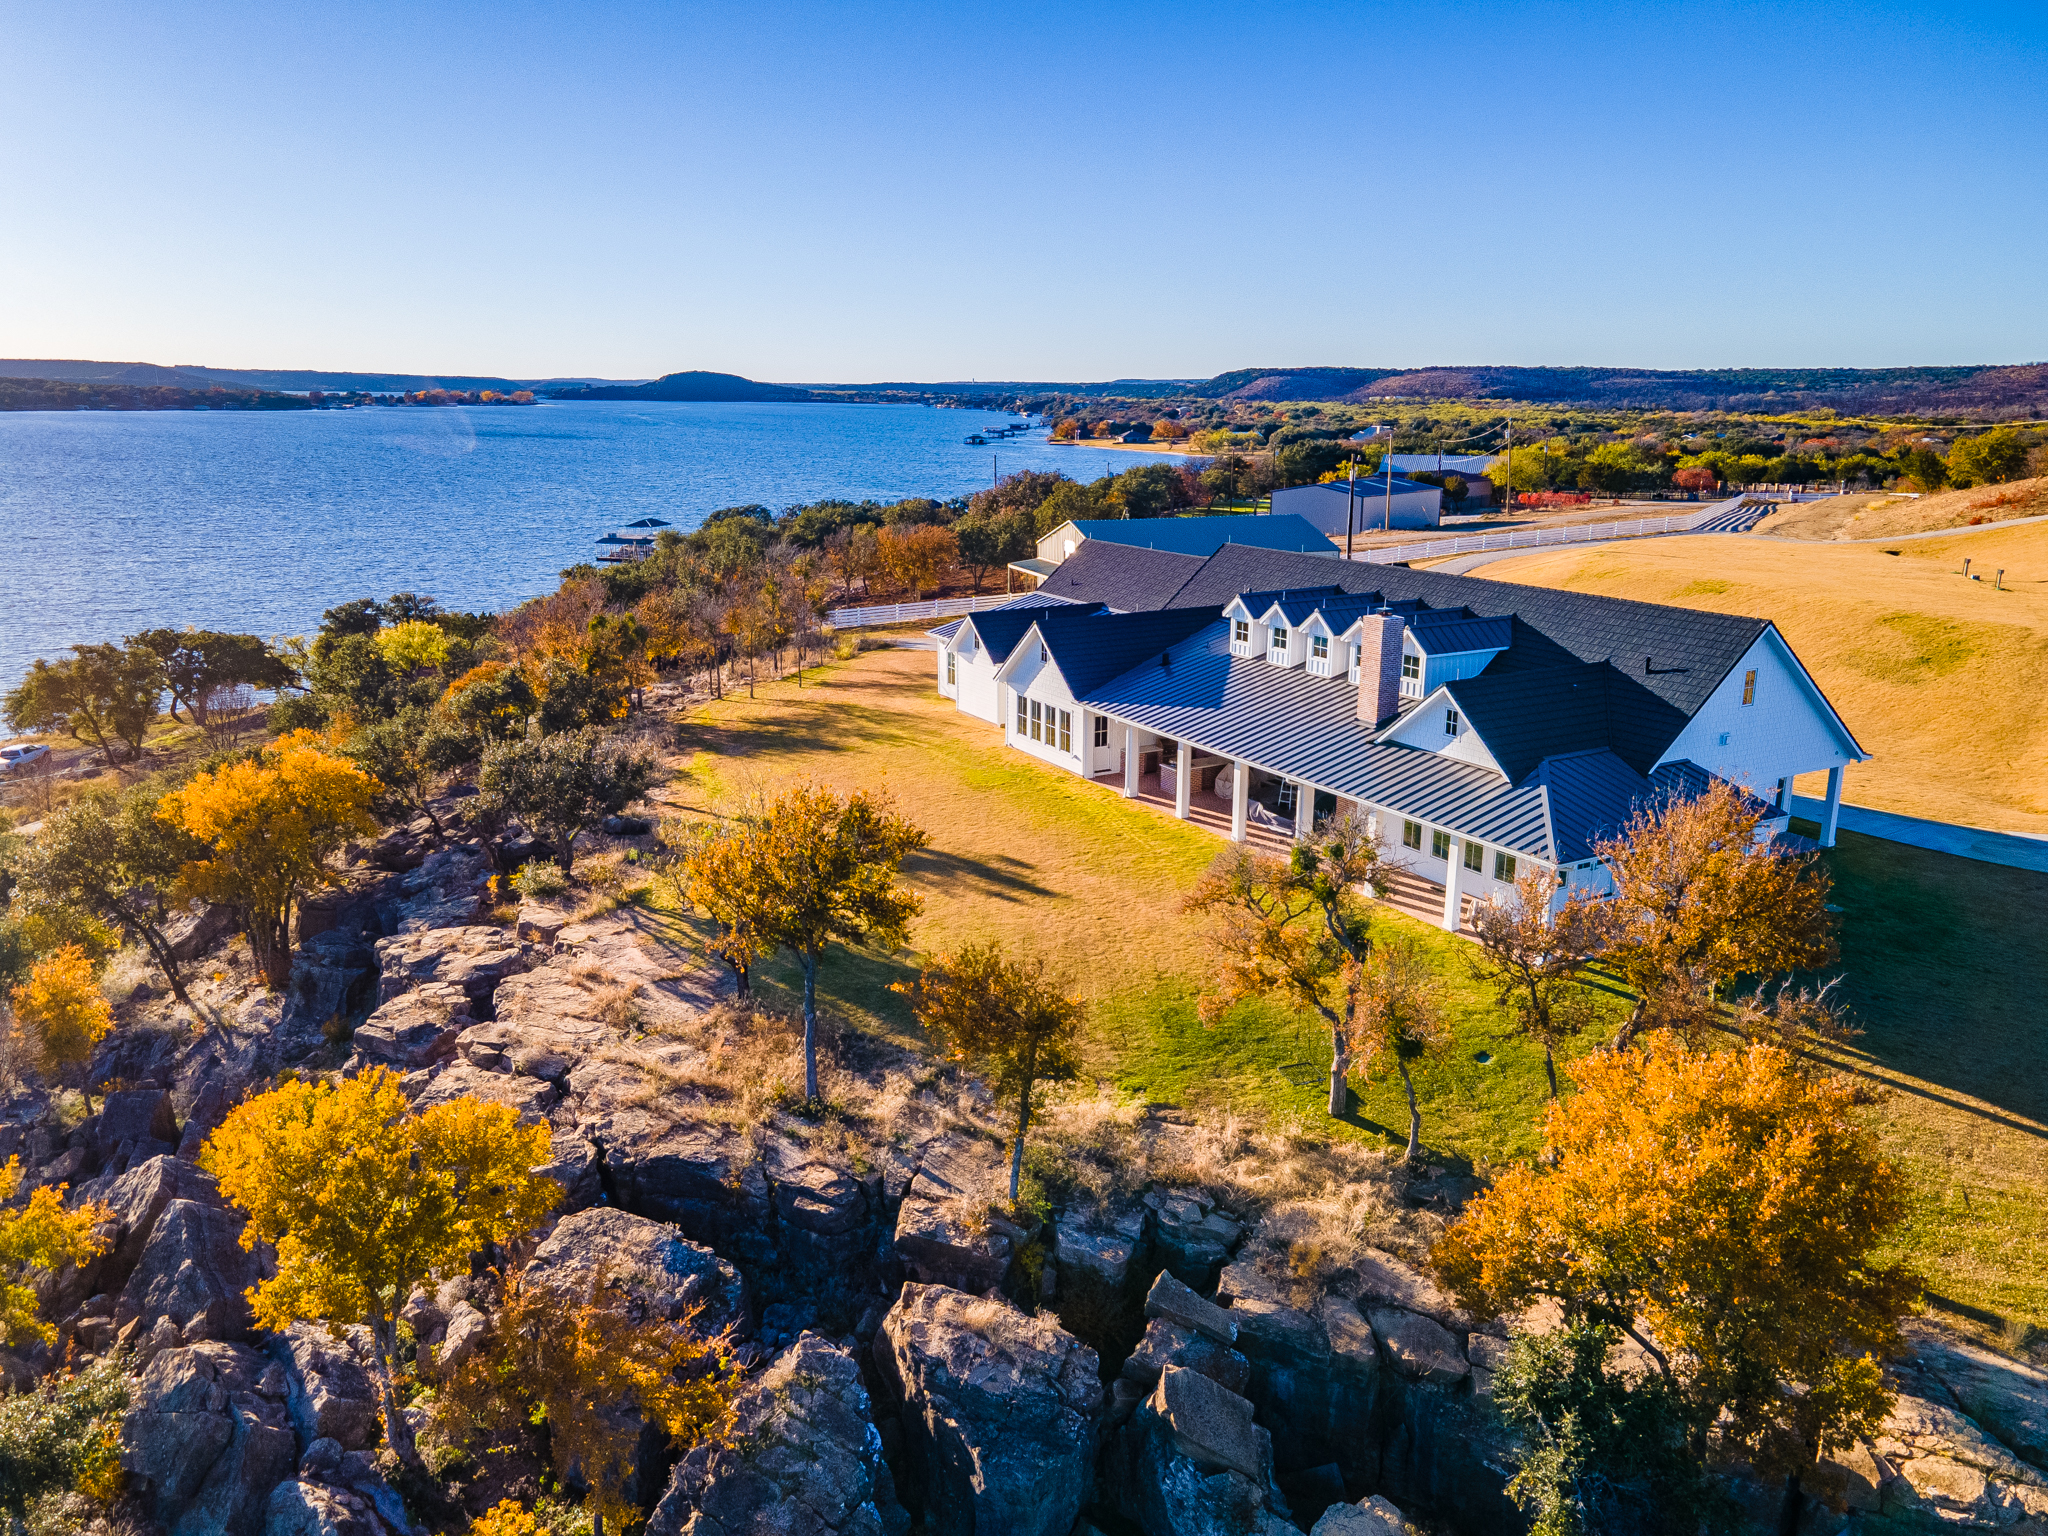
Houses
The housing market saw an increase in sales in the 4th quarter of 2023, with 5 sales compared to just 1 in 2022. The average sales price rose from $999,000 to $1,142,000, accompanied by an increase in the average price per square foot from $254.41 to $339.85, indicating a substantial appreciation in house values. The average age of homes sold in 4th quarter 2023 and 2022 was approximately 18 years old at the time of sale.
Condos
Condo sales remained consistent with one sale in each 4th quarter of 2022 and 2023. However, there was a stark increase in the average sales price, from $5,000 to $465,000, and in the price per square foot from $209.84 to $281.84, highlighting a significant shift in the condo market’s value.
Annual Comparison

Lots
In 2023, the real estate market for lots saw a decrease in the number of transactions compared to 2022, with 36 sales in 2023 against 85 in 2022. However, the average sales price showed a notable increase, rising from about $22,345 in 2022 to approximately $63,237 in 2023. This significant rise in average price, coupled with a slight increase in average lot size from 0.23 acres in 2022 to 0.26 acres in 2023, suggests a market shift towards larger and more valuable lots.
Houses
The housing market in 2023 witnessed a slight decrease in the total number of sales, with 16 properties sold compared to 17 in 2022. Despite the decrease in sales volume, the average sales price saw a substantial increase, moving from roughly $721,360 in 2022 to about $955,534 in 2023. This increase was accompanied by a notable rise in the average price per square foot, escalating from $254.41 in 2022 to $339.85 in 2023. These figures indicate a significant appreciation in house values over the year. In 2022, the average age of houses sold was approximately 14.76 years versus in 2023, this average age increased to about 16.19 years.
Condos
The condo market in 2023 experienced an increase in both sales volume and value. The number of sales went up to 6 from 4 in 2022. The average sales price also grew considerably, from approximately $311,667 in 2022 to $495,417 in 2023. This growth was mirrored in the average price per square foot, which rose from around $209.84 in 2022 to $281.84 in 2023. These trends demonstrate a robust growth in the condo market, highlighting both an increased demand and a rise in property values.
Additional Insights
- Market Dynamics: The overall market dynamics indicate a shift towards higher-value properties in both houses and condos. This trend could be driven by various factors, including changes in buyer preferences, market conditions, or the types of properties being sold.
- Lot Market Trends: The lot market showed a unique trend with an increase in average lot size but a decrease in average price, suggesting a potential oversupply of lots.
- Property Size Trends: For houses, the increase in average square footage alongside the rise in sales price in 2023 suggests a market inclination towards larger, more luxurious homes. This trend was not as pronounced in the condo market, where the number of sales and average prices increased, but the change in average square footage was less significant.
- Condo Market Resilience: The condo market showed resilience with consistent sales and a notable increase in value, indicating a sustained or growing interest in this type of property.

This comprehensive analysis reflects a real estate market in 2023 characterized by a preference for higher-value properties, a resilient condo market, and a shift in the lot market towards larger but less expensive lots compared to 2022. Overall, the real estate market in 2023 presented a diverse landscape. While the total number of transactions in some categories saw a decrease, the average sales price and price per square foot in houses and condos showed a marked increase, reflecting a trend towards higher-value properties. The lot market, in particular, exhibited a shift towards the sale of larger, more expensive lots, underlining the dynamic nature of the real estate market.

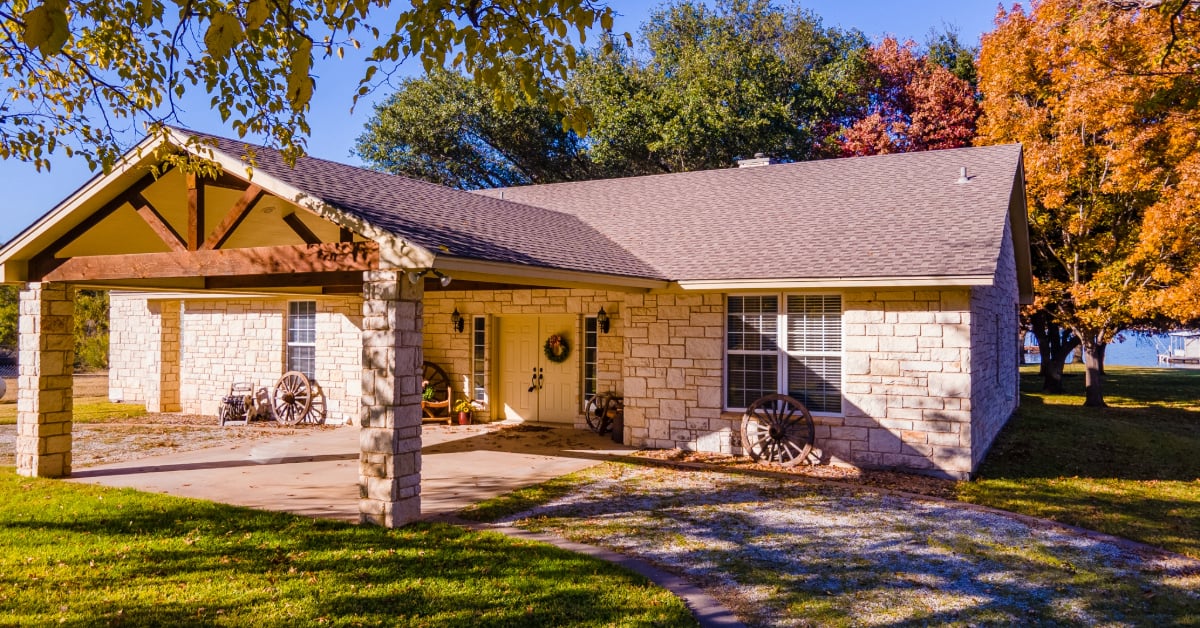
Lot 109 Oak Tree Dr. fall in The Cliffs
Additional Links
2023 Third Quarter Report can be found here
Explore The Cliffs Resort – Overview Video

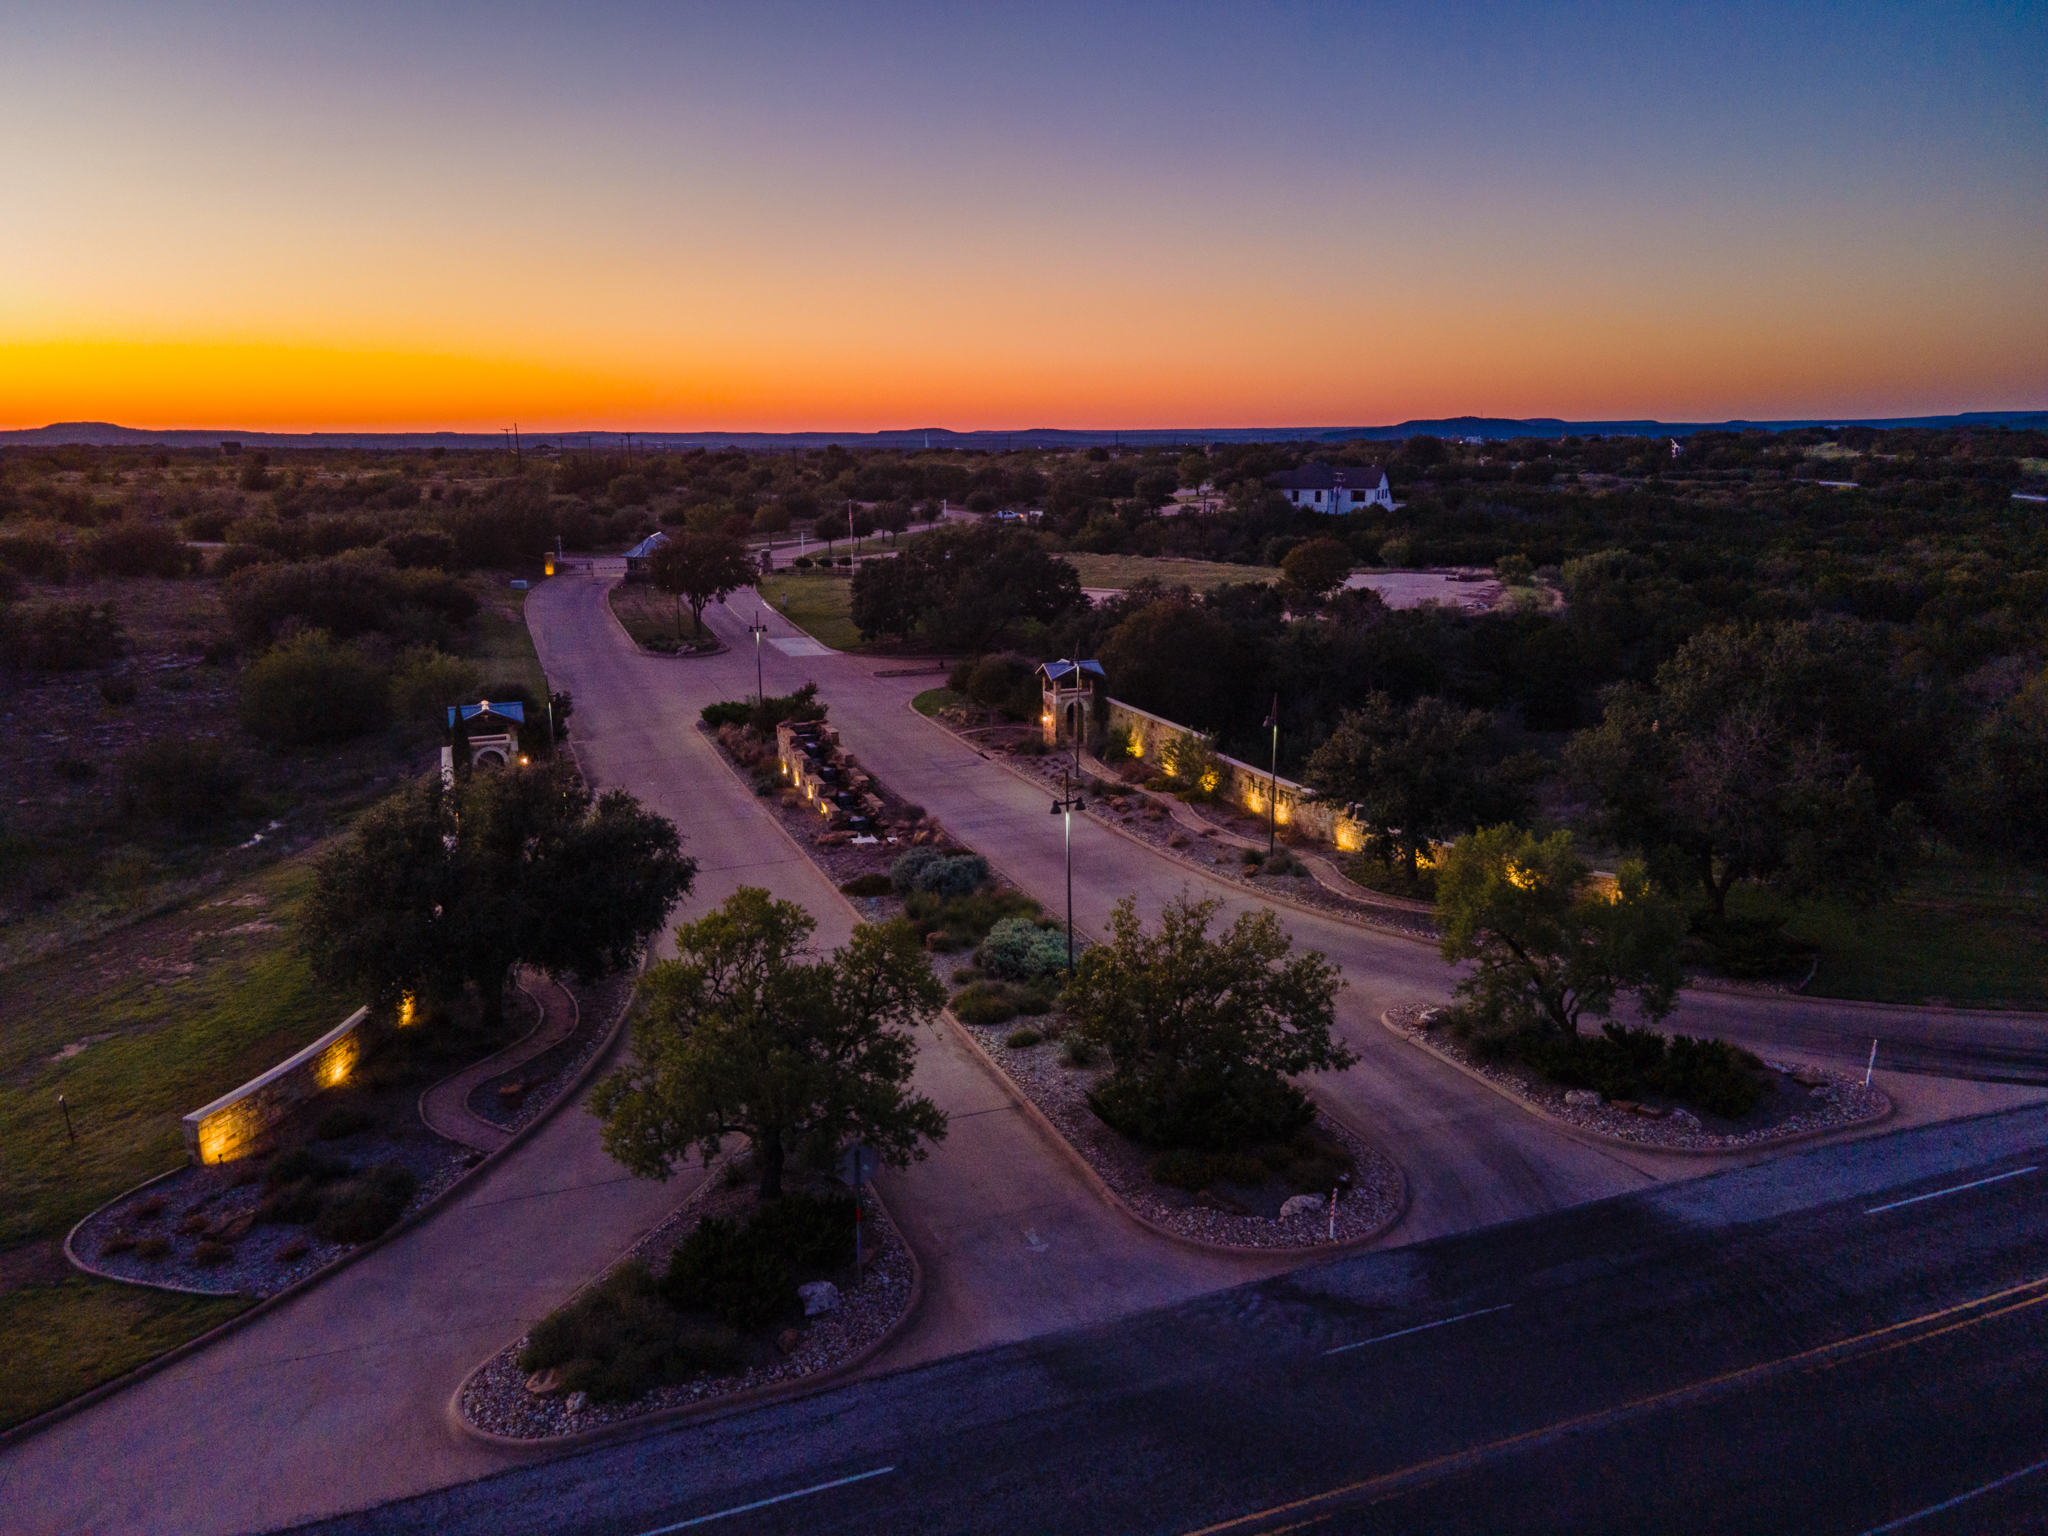
The Cliffs Golf Course at Sunset
Post created and edited by Matthew Renfro
Photography by Matthew Renfro, Licensed Drone Pilot